

Why the right chart matters
A chart has one job: to make a number easier to understand than the table it came from.
Bar, line, and pie charts are the three you will reach for most, and each is built around a different question. A bar chart answers which category is bigger. A line chart answers how something changed over time. A pie chart answers how a single total splits into parts. When the chart matches the question, the reader sees the point at a glance. When it does not, they have to work to decode it, and a good finding gets lost.
The choice is rarely a judgment call. It follows from the shape of your data and the sentence you want the reader to walk away with. The three sections that follow take each chart in turn, colour-coded so you can tell them apart, and then a side-by-side contrast shows why the same numbers can suit one and not another.
Bar charts: comparing categories
A bar chart compares values across a set of distinct categories, such as revenue by region, votes by candidate, or units sold by store. Length does the work: the longer the bar, the larger the value, and the eye compares lengths accurately. That makes the bar chart the most reliable of the three for reading exact differences.
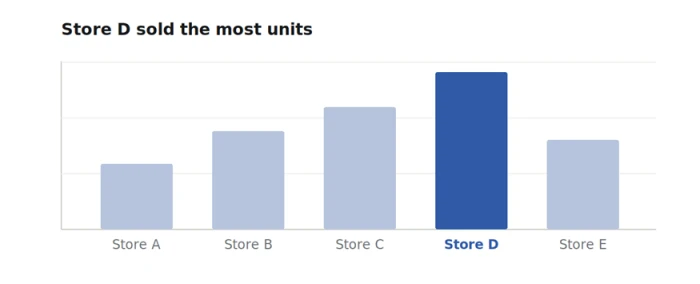
Bars share a common baseline at zero, so the reader compares heights directly. Highlighting one bar points straight at the finding.
Use it for: Comparing a value across a handful of separate categories.
Data it suits: One number per category, with categories that have no natural order.
Skip it when: You are showing change across many time points, where a line reads better, or a category has too many items to label cleanly.
The rule that matters
Always start the value axis at zero. Because a bar’s length is the value, cutting the axis exaggerates small differences and misleads the reader. To zoom in on a narrow range, switch to a line chart with a labelled axis. For long category names, turn the bars horizontal so the labels stay readable.
Line charts: change over time
A line chart shows how a value moves across a continuous scale, almost always time. The slope carries the message: rising, falling, steady, or spiking. Because the points are connected in order, the reader follows the whole trend as a single shape rather than reading each value on its own, which makes a line the natural choice for anything measured repeatedly.
Time runs left to right and the slope tells the story. A line absorbs many points that a row of bars would crowd.
Use it for: Showing a trend, a pattern, or a turning point across a continuous period.
Data it suits: Ordered data measured at regular intervals, such as daily, monthly, or yearly values.
Skip it when: Your categories have no order, since a connecting line implies a progression that is not there.
The rule that matters
Keep the number of lines low. Two or three series stay readable; a tangle of seven becomes a plate of spaghetti. When you must show many, highlight the one that matters and grey the rest, or split them into small separate charts.
Pie charts: parts of a whole
A pie chart splits a single total into slices, so it answers one narrow question: what share does each part take of the whole. It works when there are only a few slices and one clearly dominates, because the reader can see roughly a half, a quarter, or a sliver at a glance. Its weakness is precision, since the eye judges angles and areas far less accurately than it judges the length of a bar.
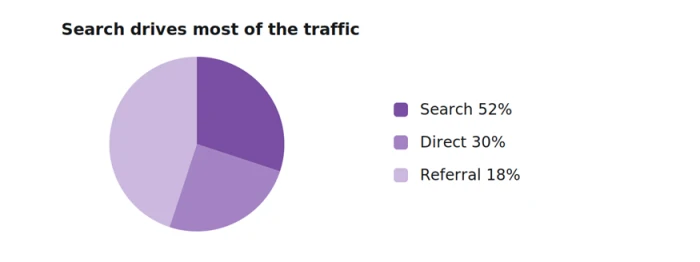
A pie works here because there are only three slices and one clearly leads. Labelling each slice with its share removes the guesswork.
Use it for: Showing how one total divides into a small number of parts.
Data it suits: Two to five categories whose values add up to a meaningful 100 percent.
Skip it when: You have more than about five slices, the values sit close together, or you want the reader to compare parts precisely.
The rule that matters
If you find yourself adding a long legend, tilting the pie into 3D, or exploding the slices apart, the data has outgrown the format. Switch to a bar chart, which compares the same parts more clearly and holds far more categories without strain.
See the difference: same data, three charts
The clearest way to feel the distinction is to watch one dataset move between the three. The deciding factor is almost always the structure of the data, not taste.
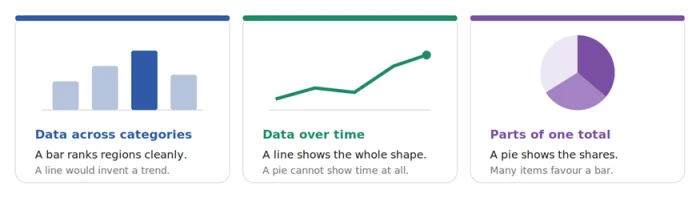
Data across categories favours a bar, data over time favours a line, and parts of one total can suit a pie.
Two head-to-head differences that decide it
Bar vs Line
A bar reads an exact value, while a line reads a direction. Given the same twelve months of revenue, the line shows the overall shape in one glance and the bars show each month’s precise height. Choose by whether the reader needs the exact figure per point or the trend across all of them.
Pie vs Bar
Both can show parts of a total, but a pie communicates share of a whole, whereas a bar lets the eye compare the parts precisely against each other. With two or three slices a pie is friendlier; beyond about five, the bar wins because angles become impossible to rank by eye.
How to choose in seconds
Start from the sentence you want the reader to take away, then match it to the chart. The table below is the short version, colour-coded to the sections above.
| Chart | Answers the question | Data it suits | Reach for another when |
| Bar | Which category is bigger? | One value per distinct category | You are tracking change over time |
| Line | How did it change over time? | Ordered values at regular intervals | Categories have no natural order |
| Pie | What share is each part of the whole? | A few parts that sum to 100 percent | You have many parts or need precision |
One rule covers most cases. If time sits on the horizontal axis, use a line. If you are ranking or comparing separate things, use a bar. If you are showing a single total broken into a few parts, a pie can work, though a bar is the safe default whenever you are unsure.
Common mistakes to avoid
Most misleading charts come from a handful of repeat offenders. These are worth checking for before you share.
1. Cutting a bar chart’s axis so it does not start at zero, which makes a small gap look like a large one.
2. Using a pie chart for more than about five slices, where the shares blur together and the legend takes over.
3. Connecting unordered categories with a line, which invents a trend that does not exist.
4. Adding 3D effects, drop shadows, or heavy gradients that distort the very lengths and angles the reader is judging.
5. Colouring every bar or slice differently when the colours carry no meaning, which adds noise instead of signal.
Tools that make these charts
Once you know which chart you need, these four turn your data into it quickly. They are ordered from the most publication-focused to the most interactive, and each entry notes where it fits and how it differs from the others.
TOOL 01
Datawrapper
Publication-ready charts, popular with newsrooms.
Datawrapper is a browser tool built for clean, responsive charts that are ready to publish. You paste or upload your data, choose a chart type, and it applies sensible defaults for labels, colours, and spacing, then hands back an image or an embed. It is a strong pick when the chart will appear in an article or on a website and needs to look considered without a designer.
Best for: Clean, embeddable charts for articles, blogs, and reports.
How it differs: Output is tuned for publishing and embedding, not for spreadsheet-side editing.
TOOL 02
Google Sheets
Charts built into the spreadsheet you already use.
Google Sheets makes a chart straight from a selected range, and its recommendations suggest a suitable type based on the shape of the data. It is free, familiar, and fine for everyday bar, line, and pie charts that live inside a spreadsheet or a slide. The trade-off is that the default styling is plain, so it suits internal work more than a polished external piece.
Best for: Quick charts from data that already sits in a spreadsheet.
How it differs: The chart lives with your data, so it updates as the sheet changes.
TOOL 03
ChartGPT.CO
Describe the chart or paste a table, and get a finished figure in seconds.
ChartGPT is the fastest route from raw numbers to a clean chart. You paste a range from Excel or Sheets, upload a CSV, or type the values into a sentence, and it reads the data, picks a sensible chart, and draws it with good practice already applied. Bars start at zero, rankings are sorted, one series gets one colour, and the title states the finding rather than naming the axes. It covers the three charts in this guide plus donut, area, scatter, and more, and exports as PNG, SVG, or PDF with no account needed to try it.
Best for: One clean, correctly built chart for a deck, report, or post fast.
How it differs: You describe the chart in plain language instead of configuring it, and the honest defaults are applied for you.
TOOL 04
Flourish
Interactive and animated charts for storytelling.
Flourish turns data into interactive and animated visuals through a library of templates. Beyond static bar, line, and pie charts, it can build charts that move, respond to a hover, or step through a story, which suits a presentation or a web page where you want the reader to engage rather than glance. It is more than you need for a single static chart, but it shines when the visual is the centrepiece.
Best for: Interactive or animated charts embedded in a story or presentation.
How it differs: The charts are built to move and respond, where the other three deliver a still image.
Final word
Bar, line, and pie are not competing for the same job. A bar compares, a line tracks change, and a pie shows a split. Decide what you want the reader to understand, let that choose the chart, and keep the design quiet so the data speaks. When you are unsure, a bar chart is the dependable default, and a good tool will apply the honest defaults for you so the chart makes its point the moment it appears.