
The short answer VOR Score measures how much authority your brand has inside AI answers. It splits that into three questions: do models mention you, do they describe you correctly, and do they recommend you. Each part is scored 0 to 100, then combined into one figure. The point of keeping them separate is that a bad score tells you which of the three is broken, so you know what to fix. |
| Field | Detail |
|---|---|
| Stands for | Visibility, Ownership, Recommendation |
| Who it is for | Marketing, SEO and PR teams tracking AI search |
| Status | An open framework, not a vendor product or a standard |
| Built from | Published vendor metrics plus two academic papers |
Six terms used throughout
Mention. The AI names your brand in its answer.
Citation. The AI links to your website as a source.
Prompt. One question you test, such as “best CRM for agencies”.
Run. One time you ask that question. Same question, different runs, different answers.
Share of voice. Your mentions as a share of every brand mentioned.
Engine. ChatGPT, Gemini, Perplexity, Google AI Mode, Claude and similar.
The three layers
The layers build on each other. You cannot be described well if you are never mentioned, and you cannot be recommended if the description is wrong. That order is why they carry different weights.
| Layer | What it asks | Weight |
|---|---|---|
| V Visibility | Do AI assistants bring you up at all? | 0.40 |
| O Ownership | When they do, have they got you right? | 0.35 |
| R Recommendation | Do they actually point buyers at you? | 0.25 |
V - Visibility Weight 0.40 Do AI assistants bring you up at all? Not once, but reliably, and on more than one platform. What you count • Share of your test questions that produce a mention • Mentions divided by total answers you tracked • How many engines you appear on • How often you appear when you repeat the same question When this breaks: you are invisible. Buyers research the category and never encounter your name. |
O - Ownership Weight 0.35 When you do come up, does the AI have you right? The correct category, the correct claims, sourced from pages that hold up. What you count • Whether the model identifies your category and claims correctly • How often it links to your site as a source • The quality of the third-party pages carrying you • Whether the tone is positive, neutral or cautionary When this breaks: you appear, but in the wrong category or with outdated facts. Buyers rule you out for the wrong reason. |
R - Recommendation Weight 0.25 Being named is not being chosen. This layer asks whether the AI actually points buyers at you, and how prominently. What you count • How often you are recommended rather than just listed • Your average position in the answer • Quality of the positioning, scored 0 to 2 per answer • Your mentions as a share of all brand mentions When this breaks: you are mentioned everywhere and recommended nowhere. The score looks healthy while the pipeline stays flat. [16] |
| In short: three layers, three different failure modes, three different fixes. That separation is the whole reason for the framework. |
Why one number is not enough
Most AI visibility tools give you a single figure between 0 and 100. Two findings explain why that figure alone is thin.
Engines do not agree with each other
Ask ChatGPT, Gemini, Perplexity and Google AI Overviews the same question and they mostly pull from different sources. A study of 161,286 prompts found the four share roughly 17 percent of their cited sources, and only 3.8 percent are cited by all four.
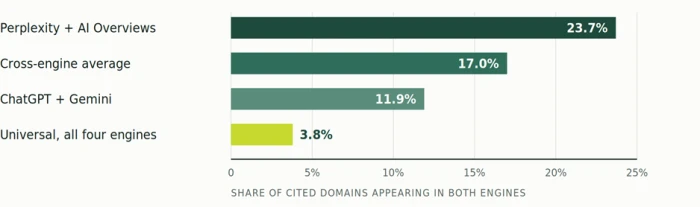
Figure 1. Sources shared between engines
Even the closest pair, Perplexity and Google AI Overviews, only agrees on about a quarter of the sites it cites. Measuring one engine tells you very little about the others.
Google rankings do not close the gap either. Ahrefs looked at 15,000 prompts and found only 12 percent of the URLs assistants cited were ranking in Google's top 10.
The same question gives different answers
AI answers are not fixed. One study re-ran 1,247 buying questions every day for 90 days across eight platforms. On any given day, 17 percent of those questions came back with at least one different brand recommended.
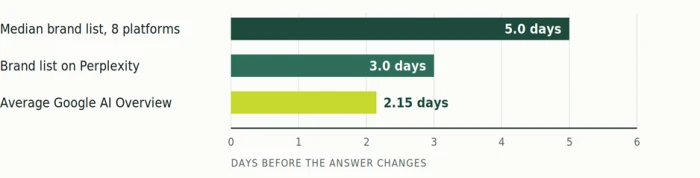
Figure 2. How long an AI answer stays put
A screenshot of an AI answer describes one day, not a settled position. Plan your reporting cadence around this.
MaxAEO, 1,247 prompts across 8 platforms over 90 days . AI Overview figure from an Ahrefs analysis of more than 43,000 overviews .
Similarweb documented a brand going from 86 percent presence on a prompt in one period to 14 percent in the next, with no changes to its own website. A separate vendor analysis found roughly 30 percent of brands stay visible from one answer to the next.
| In short: measure several engines, and measure the same question several times. A single reading from a single engine is close to meaningless. |
How to calculate it
Score each layer 0 to 100, then apply the weights.
VOR = (0.40 × V) + (0.35 × O) + (0.25 × R) V = average of prompt coverage, mention rate, engine breadth, stability O = average of entity accuracy, citation rate, source quality, sentiment R = average of recommendation rate, placement, quality rubric, share of voice |
Adjust the weights if your situation calls for it. A B2B team selling to researchers may weight source quality higher; a local service business may care more about raw mentions. Keep the three-layer structure regardless, because merging everything into one mention count is exactly what hides the difference between being seen and being chosen.
The eight inputs
| Input | What it means | A useful reference point |
|---|---|---|
| Prompt coverage | Share of your test questions that mention you | Above 20% is strong. Most B2B brands sit under 10%. |
| Mention rate | Mentions divided by all answers tracked | How Profound and Similarweb define their scores. |
| Engine breadth | How many engines return a mention | Only 3.8% of sources are cited by all four engines. |
| Stability | How consistent you are across repeat runs | Median brand list survives 5 days. |
| Citation rate | Share of answers linking to your site | Only 12% of cited URLs rank in Google's top 10. |
| Source quality | Authority of the pages carrying your name | About 85% of mentions come from third-party pages. |
| Quality rubric | Positioning accuracy, scored 0 to 2 per answer | 2 accurate, 1 vague, 0 misleading. |
| Share of voice | Your mentions over all brand mentions | 62% brand disagreement across three major surfaces. |
How to run the measurement
You do not need a platform to start. You need a fixed list of questions, a schedule, and the discipline to keep both the same.
01 - Write your question list and freeze it
Twenty-five to fifty real buying questions. Tag them by how close they are to a purchase, and report the high-intent ones separately so casual questions cannot flatter your average.
02 - Ask each question twelve times per engine
This is not overkill. A study covering 23,040 answers found roughly one in five single-run readings pointed in the wrong direction.
03 - Cover four engines minimum
ChatGPT, Google AI Mode, Gemini and Perplexity are the common baseline, with Claude, Copilot and Grok worth adding if your buyers use them.
04 - Record three things per answer
Were you named, was your site linked, and where in the answer did you appear. Keep these in separate columns. Merging them is what destroys the diagnostic value later.
05 - Report a range, not a point
Give the score with a confidence interval and name the engines and question list behind it. Read the trend over eight weeks or more, not week to week.
| In short: same questions, same engines, twelve runs, eight weeks. Change one of those and your trend line stops meaning anything. |
What actually moves the score
The founding research here is a 2024 paper from Princeton and collaborators that coined the term Generative Engine Optimization. It tested content changes across roughly 10,000 queries and found visibility gains of up to 40 percent.
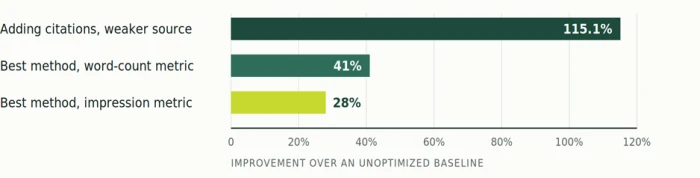
Figure 3. What the research measured
Two ways of measuring visibility moved at different rates on the same content changes, which is one more argument for keeping your sub-scores visible. Gains were also largest for pages in weaker positions, so there is more headroom if you are currently behind.
Most of the work happens off your own site
This is the finding that surprises people. AI systems lean on third-party pages far more than on your own.
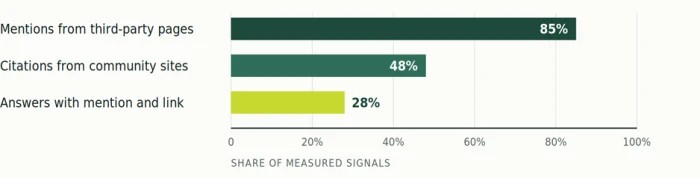
Figure 4. Where your Ownership score actually lives
Roughly 85 percent of brand mentions come from pages you do not control, and about half of citations come from community sites such as Reddit and YouTube. Only 28 percent of answers carry a brand with both a mention and a link, though brands with both are 40 percent more likely to reappear.
| In short: publishing more pages on your own site is the slower lever. Earned coverage and clear third-party descriptions of what you do move the Ownership layer faster. |
What it is worth in revenue
The commercial case changed sharply in the space of a year. Adobe reported that in March 2026 visitors arriving from AI assistants converted 42 percent better than everyone else. Twelve months earlier, the same channel converted 38 percent worse.
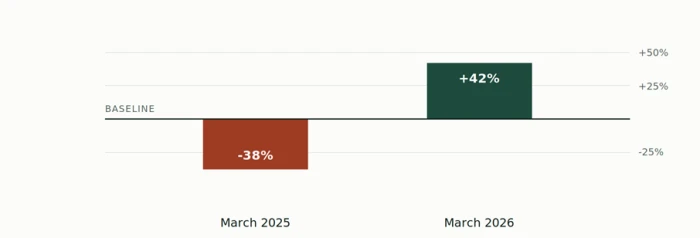
Figure 5. How AI-referred visitors convert compared with everyone else
An 80-point swing in twelve months. Early AI traffic was curious; current AI traffic has already read a comparison before it arrives.
Adobe Digital Insights, Q1 2026, across more than one trillion visits to US retail sites.
Clicks are also the smaller half of the story. Similarweb research indicates AI recommendations make people 2.5 times more likely to visit a brand through a branded search rather than by clicking a link in the answer. That traffic lands in your analytics as organic or direct, which is precisely why measuring the answer surface directly is worth the effort.
Where the framework breaks down
Say these three things out loud before you put a VOR Score in front of anyone.
1. A single reading can be noise
A 2026 research preprint argues these metrics should be treated as estimates drawn from a distribution rather than fixed values, and shows that many apparent differences between brands sit inside the measurement noise. Report a range.
2. You cannot compare across tools
Two platforms can score the same brand at 45 and 22 while nothing about that brand has changed, because they use different engines, question sets and weightings. Pick one method and stay with it.
3. Vendor data conflicts
A live example One 2026 panel put ChatGPT at 92.4 percent of trackable AI referral traffic across 6.77 million sessions. Another, looking at B2B referrals in March and April 2026, put ChatGPT at 62.6 percent with Claude at 18.5 percent and Gemini at 10.6 percent. Both are published. They are not measuring the same thing. |
Verdict
| Judged as | Call | Why |
|---|---|---|
| A diagnostic | Use it | Splitting presence, accuracy and preference tells you which problem you have. A single number tells you nothing you can act on. |
| A precise figure | Do not trust it | Single readings are misleadingly exact, and real differences often sit inside the noise. Always publish a range. |
| A competitor benchmark | Only inside one method | Cross-tool comparison is meaningless. Two tools can score the same brand more than twenty points apart. |
| A trend line | Use it, with discipline | Twelve runs, four engines, eight weeks, held steady. That gives you a slope worth acting on. |
BOTTOM LINE Adopt VOR Score as a way to organise your reporting. Do not present the combined number as a fact. The three-layer split is the valuable part, because each layer breaks for a different reason and needs a different fix. If you remember one rule: show V, O and R with their ranges, name the engines and questions behind them, and ignore any weekly move smaller than your own measured variation. |