
Conversion rate optimization (CRO) is the practice of increasing the share of visitors who take a desired action: signing up, activating, or paying. For SaaS teams selling AI products, the stakes are higher because every free user consumes real compute.
This guide walks the full self-serve funnel, from the landing page to the paid plan. Each section explains what the stage is, what the 2026 data says about it, and what changes when the product is powered by AI.
What CRO means and how to measure it
A conversion is any action you have decided matters: a trial signup, a demo request, a first successful output, or a paid upgrade. The conversion rate is the share of people who took that action out of everyone who could have.
Conversion rate = conversions ÷ unique visitors × 100
Worked example
10,000 unique visitors reached the landing page last month. 500 of them created an account.
500 ÷ 10,000 × 100 = 5% visitor-to-signup conversion.
Of those 500 signups, 40 later paid. 40 ÷ 500 × 100 = 8% signup-to-paid conversion.
Two measurement habits keep the numbers honest. Count unique visitors rather than page views, and measure the conversions and the visitors over the same time window.
CRO improves these rates by changing the page, the flow, the offer, or the message, then measuring the difference. The practice works best when each change is tied to a specific stage of the funnel rather than a vague goal of "more customers."
For a general introduction to the practice beyond SaaS, HubSpot's conversion rate optimization guide covers the common page types and testing methods.
Why AI products need a different CRO playbook

Traditional SaaS CRO assumes a free user costs almost nothing to serve. That assumption held because serving one more dashboard or one more document was close to free once the software existed.
AI products break the assumption in three ways, and each one changes how you should design the funnel.
1. Compute is a real cost of goods
Bessemer Venture Partners reports that AI companies see 50 to 60% gross margins versus 80 to 90% for classic SaaS, because every query incurs compute cost.
The consequence for CRO is direct. A free tier that would be harmless for a note-taking app can become a large monthly bill for an AI product, so free usage has to be bounded and activation has to happen fast.
Why this matters in numbers
Suppose each free signup costs you $0.30 in inference during the trial. At 10,000 free signups a month, that is $3,000 a month before a single customer pays.
At an 8% free-to-paid rate you would gain 800 customers from those signups. At 4% you would gain 400 for the same compute spend. Conversion rate and cost per signup have to be managed together.
2. Pricing has two dimensions
In the 2026 State of B2B SaaS and AI Monetization survey by Growth Unhinged, hybrid pricing (for example, a per-seat subscription with AI consumption on top) was the most popular model at 37% of companies.
A hybrid model means the pricing page has to explain two things at once: what the base plan includes and how the metered part is counted. Buyers who do not understand the second part tend to delay the purchase.

3. Buyers ask new questions
Where does my data go? Does it train your model? How accurate is the output, and who checks it? These objections sit directly on the path to signup, and a page that ignores them loses visitors who were otherwise ready.
Section 8 covers how to answer them on the page. The short version: treat trust content as part of the conversion flow, not as a legal appendix.
What stays the same
The fundamentals of CRO still apply. Message match, a single clear call to action, fast pages, short forms, and disciplined testing work for AI products the same way they work for any software. The sections below apply those fundamentals stage by stage, then add the AI-specific layer.
2026 conversion benchmarks

Benchmarks tell you whether a number is surprising. They do not tell you why, so use them to decide where to look first rather than as targets in themselves.
Two datasets dominate 2026 SaaS benchmarks, and they disagree, so it helps to know where each comes from.
• ChartMogul SaaS Conversion Report (January 2026). Produced with Growth Unhinged and ProductLed across 200 B2B software products of mixed size. This is the broadest dataset and the one this guide leans on most.
• First Page Sage. Reports on its own B2B SaaS client base of 50+ companies. The numbers run higher, which likely reflects a more established set of firms.
• Unbounce Conversion Benchmark Report. Built on 41,000 landing pages across industries, with SaaS broken out separately.
| Funnel stage | Benchmark | Source |
|---|---|---|
| SaaS landing page conversion | Median 3.8%, top quartile 11.6% | Unbounce Conversion Benchmark Report (41,000 landing pages) |
| B2B SaaS visitor to lead | Median 2.4%, top quartile 6 to 10% | First Page Sage, 2026 |
| Visitor to signup, freemium | About 9% | ChartMogul, 2026 |
| Visitor to signup, free trial (no card) | About 4.5% | ChartMogul, 2026 |
| Visitor to signup, free trial (card required) | About 3.5% | ChartMogul, 2026 |
| Free to paid, median across all models | 8% | ChartMogul, 2026 |
| Opt-in trial to paid (no card) | About 9% (ChartMogul) / 18.2% (First Page Sage) | Two datasets, see note |
| Opt-out trial to paid (card required) | About 30% (ChartMogul) / 48.8% (First Page Sage) | Two datasets, see note |
Why two numbers for trials: ChartMogul surveyed 200 products of mixed size. First Page Sage reports on its own client base, which skews toward established firms. Benchmark against the dataset that looks most like your company.
Read the whole funnel, not one rate
Trial-to-paid rate on its own can mislead. A model that converts a high share of signups may still produce fewer customers if it scares most visitors away before they sign up.
ChartMogul's per-1,000-visitor model makes the tradeoff visible. Each bar below shows how many of 1,000 website visitors sign up, and the darker segment shows how many of those go on to pay.
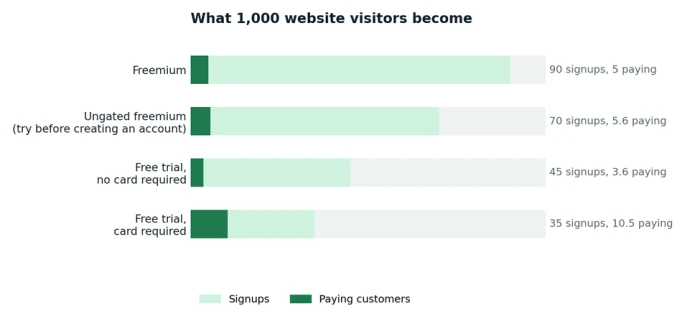
Signups and paying customers per 1,000 visitors, by model. Source: ChartMogul SaaS Conversion Report, January 2026.
Three things stand out. The card-required trial produces roughly three times the paying customers of a no-card trial from the same traffic. Freemium brings in the most people but converts few of them. Ungated freemium, where visitors try the product before creating an account, beats the standard free trial on both signups and paying customers.
How to use benchmarks without being misled by them
1. Pick the dataset that resembles you. An early-stage self-serve tool should compare against ChartMogul's medians. A sales-assisted product with larger contracts is closer to the First Page Sage numbers.
2. Compare the same stage. Visitor-to-signup and signup-to-paid are different rates. Mixing them produces meaningless comparisons.
3. Aim for the next quartile, not the top. Moving from below median to median is usually a matter of removing obvious friction. Moving from median to top quartile requires product changes, which take longer.
Landing page optimization

The landing page decides whether a visitor becomes a signup. Unbounce's benchmark puts the SaaS median at 3.8%, so a page converting above 10% is already in the top quartile.
Most landing page problems come down to one of four causes: the page does not match what the visitor expected, it asks for too many things at once, it loads slowly, or it makes claims the visitor cannot verify.
Message match
Message match means the headline repeats the promise from the ad, search result, or link that brought the visitor there. A visitor who clicked "Summarize contracts in seconds" and lands on a page titled "The AI platform for modern teams" has to work out whether they are in the right place.
The fix is to give each major traffic source its own page or headline variant. Paid search campaigns, comparison articles, and partner referrals rarely share the same intent.
One primary call to action
A page with "Start free," "Book a demo," "Watch video," and "See pricing" in the same view splits attention four ways. Choose the action that matters most for that page and make it the only button above the fold.
Write the button as what will happen next. "Summarize your first document" tells the visitor more than "Get started."
Speed
Google's Core Web Vitals treat a Largest Contentful Paint (LCP) of 2.5 seconds or less as good, 2.5 to 4 seconds as needing improvement, and over 4 seconds as poor. LCP measures how long the largest visible element takes to render.
Autoplaying demo videos, chat widgets, and multiple tracking scripts are common causes of slow LCP on SaaS pages. You can check any URL with Google's PageSpeed Insights tool, which reports LCP alongside the other Core Web Vitals.
Proof that is specific
Generic praise ("Amazing tool!") does little. Specific proof does more: a named customer, a quantified outcome, a recognizable logo, or a security certification you actually hold.
Place proof next to the claim it supports. A testimonial about time saved belongs beside the headline that promises time saved.

The AI-specific addition: let visitors try before they sign up
For an AI product, the output is the product. A static screenshot sells it worse than letting the visitor run a real prompt on the page and see what comes back.
The ChartMogul data supports this. Ungated freemium products, where people try the tool before creating an account, produced 70 signups and 5.6 paying customers per 1,000 visitors, compared with 45 signups and 3.6 paying for a standard free trial.
How to build an ungated try-it experience
• Offer a sample input. Pre-load an example document, prompt, or dataset so the visitor gets an output within seconds without preparing anything.
• Limit the runs. Allow a small number of attempts per visitor and cap the input size. This keeps compute cost predictable and keeps the preview from becoming a free tier.
• Ask for the account at the right moment. The natural point to request an email is when the visitor wants to save, export, or run the tool on their own data.
• Rate-limit by IP and session. Ungated tools attract scripted abuse. Basic rate limiting protects your inference budget.
Common landing page mistakes on AI products
• Leading with the model or technology instead of the result the user gets.
• Burying the demo below several screens of feature descriptions.
• Requiring a company email before any output is shown.
• Using screenshots of the interface rather than examples of the output.
Choosing the right trial model

The trial model decides how much of the product a visitor can use before paying, for how long, and what they must give you first. It is one of the biggest levers in the funnel because it shapes every downstream rate.
The five common models
• Opt-in free trial. Full product for a fixed period, no credit card required. The user must actively choose to pay at the end. Highest signup volume among trial types, lowest conversion.
• Opt-out free trial. Full product for a fixed period, credit card required at signup. Billing starts automatically unless the user cancels. Fewer signups, much higher conversion.
• Freemium. A permanently free tier with limits, plus paid tiers. Brings in the most users and converts a small share of them over a long period.
• Reverse trial. The user gets the full product for a limited time, then drops to a free tier rather than losing access entirely. Combines a trial's urgency with freemium's retention.
• Usage-capped trial. The user gets a fixed allowance of credits, runs, or tokens rather than a fixed number of days. The trial ends when the allowance runs out.
What the 2026 data says about trial design
• Free trials are the main front door. A free trial was the primary entry point for 57% of products in the ChartMogul report.
• 14 days is the default. 62% of products used a 14-day trial. Seven-day and 30-day trials were each used by 14%.
• Most trials skip the card. Only 20% of free-trial products required a credit card at signup.
• Card-required trials convert about 30%, more than five times the rate of card-free trials, but they cut signups.
• ChartMogul's own warning: adding a card requirement can blunt signups and reduce total paying customers unless the product justifies the friction.

What changes for AI products
A 14-day trial with unlimited usage exposes you to compute cost from power users, and the heaviest users are often the least likely to pay. A usage-capped trial protects margin and has a second benefit: it makes the value unit visible before purchase.
The market is moving in that direction. Growth Unhinged found AI credit adoption at 29% of companies, with another 33% planning to introduce credits within 6 to 12 months. Among companies above $50M ARR, roughly one in two planned to add credits this year.
How to size a credit allowance
1. Find the activation threshold. Work out how many runs a typical user needs before they reach the first useful output. Give at least double that amount, so the user reaches value and then repeats it.
2. Price the allowance in compute. Multiply the allowance by your cost per run. Multiply again by expected monthly signups. That is your trial compute budget; adjust the allowance if the total is unaffordable.
3. Show the meter from the first screen. A visible balance makes the limit feel like a feature rather than a surprise.
4. Decide what happens at zero. Options include a hard stop with an upgrade prompt, a small daily top-up, or a downgrade to a lighter model. Each has a different effect on conversion and cost, so test them.
Decision rule: judge trial models by paying customers per 1,000 qualified visitors, not by trial-to-paid rate alone.
Onboarding and activation

Most conversion problems are activation problems. A user who never reaches the product's first useful output will not pay, no matter how the pricing page is laid out.
Onboarding is the set of screens, messages, and defaults that carry a new user from signup to that first useful output. Activation is the moment they get there.
Define activation as the first useful AI output
For an AI product, activation is the moment the model produces something the user keeps: a draft, a summary, an answer, or a generated asset. Measure the time from signup to that moment, and track what share of signups ever reach it.
Activation definitions by product type
Writing assistant: the user accepts or copies a generated draft.
Code assistant: the user accepts a suggestion into a file.
Data or analytics agent: the user runs a question against their own connected data and views the result.
Support automation: the user publishes a bot that answers a real customer question.
Tactics that shorten time to value
• Pre-fill the first run. Offer sample data, templates, or an example prompt so the first output appears within the first session. The user should not have to think of something to try.
• Ask for the user's own data second. Connecting an account, uploading files, or installing an integration is a heavier ask. Place it after the demo run, when the user has seen what the product does.
• Reduce the setup steps to the ones that change the output. Workspace names, team invitations, and profile photos can wait. Anything that does not affect the first result belongs later in the flow.
• Show the meter. Display remaining credits or runs. It sets expectations and turns usage into a visible reason to upgrade.
• Make the empty state do work. An empty dashboard should suggest the first action, not describe the feature set.

Lifecycle messages that support activation
Email and in-app messages work when they are tied to what the user has or has not done, rather than sent on a fixed calendar.
• Day zero. A welcome message that contains the single next action, with a direct link into the product.
• Not activated after two days. A message that offers the sample input again, or a short video of the first run.
• Activated. A message that shows the next use case, plus the current credit balance.
• Allowance nearly used, or trial nearly over. A clear reminder with the price, what continues after upgrade, and what stops.
Measure onboarding separately
Track three rates rather than one: visitor to signup, signup to activation, and activation to paid. A single blended free-to-paid number hides which of the three is leaking.
Add median time to activation. When that number falls, paid conversion usually follows, and it is often easier to improve than the conversion rate itself.
Pricing pages for AI products

Pricing pages for AI software have to explain a value unit that most buyers have never purchased before. The model you choose sets the page's job.
The pricing models in use
• Per seat. A fixed price per user per month. Easy to budget and to buy. Weak fit for AI products where one user can generate most of the compute cost.
• Usage-based. Pay per token, call, minute, or query. Scales with value delivered. Harder for buyers to forecast.
• Credits. A bundle of usage units bought in advance. Gives the buyer a predictable spend and gives the vendor a way to meter without exposing raw token counts.
• Outcome-based. Pay when the AI completes a defined task, such as a resolved support ticket. Ties price to results but is hard to define and audit.
• Hybrid. A base subscription plus usage or credits above an included amount. Balances predictability for the buyer with cost coverage for the vendor.
Where the market is in 2026
• Hybrid is the most common model. In Growth Unhinged's survey of 230+ software companies, 37% used a hybrid model such as a per-seat subscription plus AI consumption on top.
• Early-stage companies lean on flat fees. Businesses under $5M ARR chose flat fees most often, at 37%.
• Credits are growing fast. AI credit models grew 126% year over year in 2025, per the same report.
• Seat-only pricing is fading for AI-native companies. Bessemer's 2026 playbook describes AI-native companies moving to usage-, output-, and outcome-based models, with hybrid as the middle ground when a team is uncertain.

Page tactics that reduce purchase anxiety
• State the unit in plain language. "1 credit = 1 document summary up to 20 pages" is clearer than "1 credit = 4,000 tokens." Buyers think in tasks, not tokens.
• Publish overage pricing and spend caps. Unpredictable bills are the main buyer objection to usage pricing. Showing the overage rate and a cap or alert removes the fear of an open-ended invoice.
• Add a calculator. Let the buyer enter expected volume and see a monthly figure. Stripe's guide to usage-based pricing makes the same point: customers who do not immediately understand how they will be charged hesitate to sign up, and detailed pricing pages with in-product cost calculators are the fix.
• Keep the free tier on the same page. When the free limits sit next to the paid plans, the reason to upgrade is obvious.
• Show what continues and what stops. List what happens to data, projects, and integrations if the user does not upgrade.
Handling AI-specific objections

Objections that never come up for a project management tool are routine for an AI product. Answering them next to the call to action removes friction that no button color test will fix.
Trust content is conversion content. A visitor who cannot find out whether their files train your model will often leave rather than ask.
Put these answers within one click of signup
• Data handling. State whether customer inputs are used to train models, how long data is retained, and which sub-processors touch it. Say it in one sentence each.
• Security posture. List the certifications you hold, for example SOC 2 or ISO 27001, with links to the reports or a trust center. Do not list ones you are "working toward" as if they were complete.
• Accuracy and limits. Describe what the product is good at, where it fails, and whether a human review step exists. Buyers trust products more when the vendor names the limits first.
• Model transparency. Name the providers or models behind the product if your buyers care, and explain what happens if a provider changes.
Example of a plain-language trust block
Your documents are processed to produce your results and are deleted from our servers within 30 days. We never use your content to train models.
We hold a current SOC 2 Type II report. Request it from our trust center.
Summaries can miss details in scanned or handwritten documents. Every summary links back to the source page so you can check it.
Where to place trust content
• Directly under the primary call to action on the landing page.
• On the pricing page, beside the plan comparison.
• Inside the signup flow, at the step where the user connects data or uploads a file.
• On the first-run screen, as a one-line reminder rather than a modal.
A legal PDF three clicks away does not count. If the answer is not visible where the decision is made, the visitor behaves as if the answer is bad.
Running experiments that mean something

An A/B test splits visitors between two versions of a page and compares their conversion rates. It only works with enough traffic. Below the required volume, the result is noise, and shipping known-good fixes is the better use of the team's time.
The case for testing is strong. In their Harvard Business Review article on online experiments, Ron Kohavi and Stefan Thomke describe a small headline change at Bing that was shelved for months as low priority, then tested and found to raise revenue by 12%.
How much traffic a test needs
At a 2% baseline conversion rate, detecting a 20% relative lift (2% to 2.4%) at 95% confidence and 80% power takes about 21,000 visitors per variation. Detecting a 10% lift (2% to 2.2%) takes about 80,000 per variation.
The numbers come from the standard two-proportion sample size formula. Free calculators from most testing tools give the same result if you enter the baseline rate, the lift you want to detect, and the confidence and power levels.
Most SaaS sites can only run powered tests on their highest-traffic steps: the landing page and the signup form. Deeper funnel changes are usually better handled as before-and-after measurements.
How to run a before-and-after measurement
1. Freeze other changes. Do not change pricing, traffic mix, or onboarding at the same time, or you will not know what caused the difference.
2. Compare equal cohorts. Measure signups from the four weeks before the change against signups from the four weeks after, using the same activation and paid definitions.
3. Wait for the funnel to complete. If the trial is 14 days, the "after" cohort needs at least 14 days plus a few more before its paid rate is final.
4. Segment by source. A shift in paid versus organic traffic can move conversion without the change having any effect.

Prioritize before you test
Teams usually have more ideas than test capacity. A simple scoring system keeps the queue honest. ICE scoring rates each idea on Impact, Confidence, and Ease from 1 to 10 and sorts by the total. PIE scoring does the same with Potential, Importance, and Ease.
Either method works. The point is to write the hypothesis down, estimate its effect, and compare it against the alternatives before anyone builds a variation.
Rules that keep tests honest
• Choose one primary metric per test before it starts. Secondary metrics can inform the decision but should not decide it.
• Run for full weekly cycles. Weekday and weekend visitors behave differently, and a test that ends on a Thursday has not seen both.
• Do not stop early when the result looks good. Checking the result repeatedly and stopping at the first significant reading inflates false positives.
• Segment by traffic source afterward. Paid and organic visitors often respond differently to the same change.
• Record losing tests. A losing variation tells you what your visitors do not want, which is as useful as a win.
What to test first on an AI product
• The on-page demo: prompt-first versus upload-first. Hypothesis: visitors who see an output from a typed prompt convert differently from visitors asked to upload a file first.
• The trial allowance: smaller versus larger. Hypothesis: a smaller credit bundle that runs out sooner creates an earlier upgrade decision without reducing activation.
• The pricing unit explanation: credits versus plain-language actions. Hypothesis: describing the unit as tasks rather than tokens raises pricing page to checkout conversion.
• Trust content placement: beside the CTA versus in the footer. Hypothesis: moving data-handling answers next to the signup button raises signup rate for organic traffic.
Metrics to track

Small conversion changes compound because they apply to every future cohort. Pulseahead's read of the ChartMogul 2026 data: a one percentage point gain in free-to-paid conversion produced roughly 15% more new revenue per trial cohort.
The table lists the six numbers worth reviewing every week. The first four are standard SaaS funnel metrics. The last two are specific to AI products, because they connect conversion to compute cost.
| Metric | Definition | Why it matters for AI products |
|---|---|---|
| Visitor to signup | Signups divided by unique visitors | Top-of-funnel health; the biggest lever for volume |
| Signup to activation | Share of signups reaching the first useful output | Predicts paid conversion better than any other stage |
| Activation to paid | Share of activated users who pay | Tests pricing clarity and value perception |
| Paying customers per 1,000 visitors | End-to-end yield of the whole funnel | Lets you compare trial models fairly |
| Compute cost per free signup | Inference spend divided by free signups | Sets the ceiling on how generous the free tier can be |
| Cost per activated user | Inference spend divided by activated users | Shows whether onboarding spend converts into value |

How to run the weekly review
1. Look at the three funnel rates first. Find the one that moved most since last week, up or down, and ask what changed on that step.
2. Check cost per activated user. If it is rising while activation is flat, the free experience is getting more expensive without getting more effective.
3. Review any running test. Confirm it has reached its planned sample size before reading the result.
4. Pick one change for next week. One deliberate change per week is easier to attribute than five at once.
A 90-day CRO plan, step by step

The sequence below front-loads measurement and known-good fixes, then spends the final month on tests that have enough traffic to be trusted. Each step lists what to do, why it comes at that point, and how to know it is finished.
Step 1. Weeks 1 to 2: instrument the funnel
Before changing anything, make sure you can measure the effect of changing it.
What to do
• Define activation for your product as one specific event, and log it.
• Track visitor to signup, signup to activation, and activation to paid as three separate rates.
• Pull inference spend for the free tier and divide it by free signups to get compute cost per signup.
• Choose the benchmark row from this guide that best matches your model and write it next to your numbers.
Why first
Every later step depends on knowing which stage is weakest. Teams that skip this step tend to optimize the page they like least rather than the stage that leaks most.
Done when
A single dashboard shows the three rates, time to activation, and cost per signup, updated at least weekly.
Step 2. Weeks 3 to 4: ship the known-good fixes
Some changes do not need a test because the evidence behind them is already strong.
What to do
• Get Largest Contentful Paint under 2.5 seconds on the landing and pricing pages.
• Remove every signup field you do not use in the first week of the customer relationship.
• Put the data-handling and training answers directly under the primary call to action.
• Rewrite the call to action as the action itself, for example "Summarize your first document."
Why second
These fixes raise the baseline for everything that follows. Testing a headline on a page that takes five seconds to load measures the wrong thing.
Done when
PageSpeed Insights reports a good LCP, the signup form has only the fields you need, and trust content is visible without scrolling on desktop and mobile.
Step 3. Weeks 5 to 8: rebuild the first session
This is the month with the highest expected return, because activation drives paid conversion more than any other stage.
What to do
• Add a pre-filled first run so a new user sees an output within the first minute.
• Move account connection, file upload, and integration setup to after that first output.
• Add a visible credit or usage meter to the main screen.
• Set up the four lifecycle messages from the onboarding section, triggered by behavior rather than by date.
Why third
The first session is where most trial users are lost. Fixing it also lowers cost per activated user, because fewer signups burn credits without reaching value.
Done when
Median time to activation has dropped from its week 2 value, and signup-to-activation rate is measurably higher for the post-change cohort.
Step 4. Weeks 9 to 12: run two or three powered tests
With the baseline raised and measurement in place, tests can now detect real differences.
What to do
• Score your test ideas with ICE or PIE and pick the top two or three.
• Run them only on the landing page or signup form, where traffic supports the sample size.
• Set the sample size and duration before starting, and run for full weeks.
• Review whether your trial model still wins on paying customers per 1,000 visitors, given the new activation rate.
Why last
Tests are the most expensive tool in CRO. They pay off once the obvious problems are gone and the measurement can be trusted.
Done when
Each test has reached its planned sample size, a decision has been recorded for each, and the winning variations are live.

Repeat the cycle each quarter. Benchmarks move, pricing models are shifting quickly, and the activation definition will change as the product does.
The AI CRO checklist
A compact version of everything above, to run against your funnel before each quarterly review.
- Activation is defined as one specific event and is logged.
- Visitor to signup, signup to activation, and activation to paid are tracked separately.
- Compute cost per free signup and per activated user are known.
- The landing page headline matches the traffic source that sends the most visitors.
- One primary call to action sits above the fold, written as the next action.
- Largest Contentful Paint is 2.5 seconds or less on landing and pricing pages.
- Visitors can try the product on the page before creating an account.
- The trial has a usage cap, and the cap is visible from the first screen.
- The first run is pre-filled and produces an output in the first session.
- Pricing states the unit in plain language, with overage rates and a calculator.
- Data handling, training use, and security certifications are stated next to the call to action.
- Every test has a written hypothesis, a primary metric, and a planned sample size.
Bottom line
CRO for an AI product is the same discipline as CRO for any SaaS product, with one added constraint: every free user costs money to serve. That constraint changes the order of work.
• Measure activation before anything else. Most conversion problems are activation problems, and activation is invisible in a blended free-to-paid number.
• Show the output before asking for the account. In the 2026 ChartMogul data, ungated try-before-signup products beat standard free trials on both signups and paying customers.
• Cap usage, and make the cap visible. A credit allowance protects margin and teaches the buyer the pricing unit before they reach the pricing page.
• Explain the unit in tasks, not tokens. Hybrid and credit-based models are now the norm, and the pricing page has to make them legible.
• Put trust answers where the decision is made. Data handling, training use, and accuracy limits belong next to the call to action.
• Test only where traffic supports it. Ship known-good fixes everywhere else and measure them before and after.
A one percentage point gain in free-to-paid conversion compounds across every future cohort. That is why the 90-day plan above starts with measurement, moves to fixes with strong evidence, and only then spends time on experiments.